How to Read a Nessus Report Explained 2026

Nessus is one of the most widely used vulnerability scanners for identifying security issues across networks, cloud environments, and applications. While running a scan is straightforward, understanding the Nessus report is where most teams struggle.
Nessus reports are verbose by design. A single scan can generate thousands of findings, many of which are informational, repetitive, or lack business context. This is why searches like how to read a Nessus report and nessus scan results explained continue to grow.
This guide breaks down how Nessus reports work or why they are not , how to interpret severity and plugin IDs correctly, and how to extract meaningful risk insights from Nessus scan results.
What a Nessus Report Output
A Nessus scan output typically includes:
- Discovered hosts and IP addresses
- Open ports and detected services
- Vulnerability findings tied to plugin IDs
- Severity levels (Critical, High, Medium, Low, Info)
- CVSS scores and CVE references (when available)
When exported as CSV or XML, these findings appear as flat rows, often repeated across multiple hosts and services. This structure makes it difficult to answer basic questions like:
- Which host is most at risk?
- Which vulnerabilities should be fixed first?
- Which findings are just noise?
Hosts, Ports, and Services: Where Real Risk Lives
Every Nessus finding is tied to a specific host, port, and service. This context matters more than the vulnerability name itself.
For example:
- An outdated TLS configuration on port 443 of a public web server
- An exposed RDP service on port 3389
- SSH running with weak settings on an internal jump box
The same vulnerability can have very different risk implications depending on exposure and environment. This is why raw Nessus output often needs validation and contextualization during penetration testing engagements.
Nessus Plugin IDs Explained (What Matters vs Noise)
Each Nessus finding is generated by a plugin ID, which defines how the vulnerability was detected.
Common issues with plugin-based reporting:
- The same plugin ID appears across dozens or hundreds of hosts
- Many plugins are purely informational (scan metadata, OS detection)
- Plugin output may indicate potential issues, not confirmed exploits
When users search for nessus plugin ids explained, they are usually trying to determine which findings require action and which can be ignored. Nessus does not prioritize findings across assets, which leads to alert fatigue and misaligned remediation efforts.
Nessus Plugin Severity Levels Explained: Critical, High, Medium, Low & Informational
Every finding in a Nessus scan is assigned a severity level by the plugin that detected it. That severity level is derived from the CVSS base score of the associated vulnerability — but the mapping is not always intuitive, and the way those levels surface in scan exports, imports, and pentest report templates trips up a significant number of practitioners.
This section covers exactly how Nessus severity levels map to CVSS ranges, what each level means operationally, and how the underlying plugin fields translate when you import scan data into a pentest report or vulnerability management platform.
| Severity Level | CVSS v3 Range | CVSS v2 Range | What It Means Operationally | Nessus Plugin Field |
|---|---|---|---|---|
| Critical | 9.0 – 10.0 | 10.0 | Remotely exploitable, no authentication required, likely wormable or RCE. Immediate remediation. In pentest reports: P1. | severity = 4risk_factor = "Critical" |
| High | 7.0 – 8.9 | 7.0 – 9.9 | Significant impact if exploited. May require authentication or specific conditions. Remediate within 30 days. In pentest reports: P1–P2. | severity = 3risk_factor = "High" |
| Medium | 4.0 – 6.9 | 4.0 – 6.9 | Exploitable under certain conditions or with chaining. Common in misconfigurations, outdated software, weak ciphers. Remediate within 90 days. In pentest reports: P2–P3. | severity = 2risk_factor = "Medium" |
| Low | 0.1 – 3.9 | 0.1 – 3.9 | Minimal standalone risk. Often useful for attack chaining. Includes version disclosure, weak headers, and configuration hygiene issues. In pentest reports: P3–P4. | severity = 1risk_factor = "Low" |
| Informational | N/A (no CVSS score) | N/A | No exploitable vulnerability. Passive data points: open ports, service versions, OS fingerprints, SSL cert details. Critical for attack surface mapping but excluded from most remediation SLAs. | severity = 0risk_factor = "None" |
A note on CVSS v2 vs v3 discrepancies. Nessus uses CVSS v3 scores where available — but a significant portion of older plugins still carry only CVSS v2 scores. When a plugin has both, Nessus uses v3 for severity classification. This matters when importing scan results: if your vulnerability management platform or pentest report template uses v2 scores, the severity label assigned by Nessus may not match what your import logic expects.
Nessus Plugin Output Fields: What They Mean and How They Map to Pentest Reports
When you export a Nessus scan (.nessus XML format) or import results into a vulnerability management platform, each finding is represented by a set of plugin fields. These are the fields that cause the most confusion during import mapping:
| Nessus Field (.nessus XML) | What It Contains | Maps To (Pentest Report) | Common Import Mistake |
|---|---|---|---|
| severity | Integer 0–4 (0=Info, 1=Low, 2=Med, 3=High, 4=Critical) | Severity / Risk Rating | Treating the integer as a CVSS score directly. It is not — it's a category index. |
| risk_factor | String label: "Critical", "High", "Medium", "Low", "None" | Severity label in report | Mapping "None" as a finding severity — Informational plugins return risk_factor = "None", not a blank field. |
| cvss3_base_score | Numeric CVSS v3 base score (e.g. 9.8) | CVSS Score field | Using cvss_base_score (v2) when v3 is available. Leads to severity misclassification. |
| plugin_output | Raw scanner output — version strings, banner grabs, exploit evidence, affected assets | Evidence / Proof of Concept field | Pasting raw plugin_output directly as PoC without editing — it includes noise (scan metadata, timestamps) that clutters reports. |
| solution | Tenable's recommended fix — usually a patch version or config change | Remediation Recommendation | Using Tenable's solution text verbatim — it's generic. Client-specific remediation should be written by the tester, not imported. |
| plugin_id | Tenable's unique plugin identifier (e.g. 21643 = SSL/TLS) | Reference / Finding ID (optional) | Deduplicating by plugin_id alone — the same plugin can fire on multiple hosts with different severity implications depending on context. |
| cve | Associated CVE identifier(s), if applicable | CVE Reference field | Assuming every Nessus finding has a CVE. Many misconfigurations and hardening issues have no CVE — the field is blank, not missing. |
The most common import failure in practice: tools that import .nessus XML and map the severity integer field as a CVSS score. A severity = 4 finding is Critical its actual CVSS score might be 9.8, 10.0, or anywhere in the 9.0–10.0 range depending on the specific plugin. The integer is a category bucket, not the score. Always use cvss3_base_score (or cvss_base_score for older plugins) for the actual numeric value.
If you're working with Nessus scan data directly and need to visualise severity distribution, plugin breakdown, and affected asset mapping without manually parsing XML, the SecurityWall Nessus Report Visualizer handles .nessus file imports and maps all of these fields automatically.
Why Nessus CSV and XML Reports Are Hard to Analyze
Exporting Nessus reports to CSV or XML is common, but these formats introduce major usability problems:
- Thousands of ungrouped rows with no asset-level prioritization
- Repeated plugin IDs inflating report size
- Missing or inconsistent hostnames, especially in cloud scans
- No clear visibility into high-risk hosts or exposed services
This is why many teams struggle with nessus csv report and nessus xml report analysis and resort to manual spreadsheet filtering.
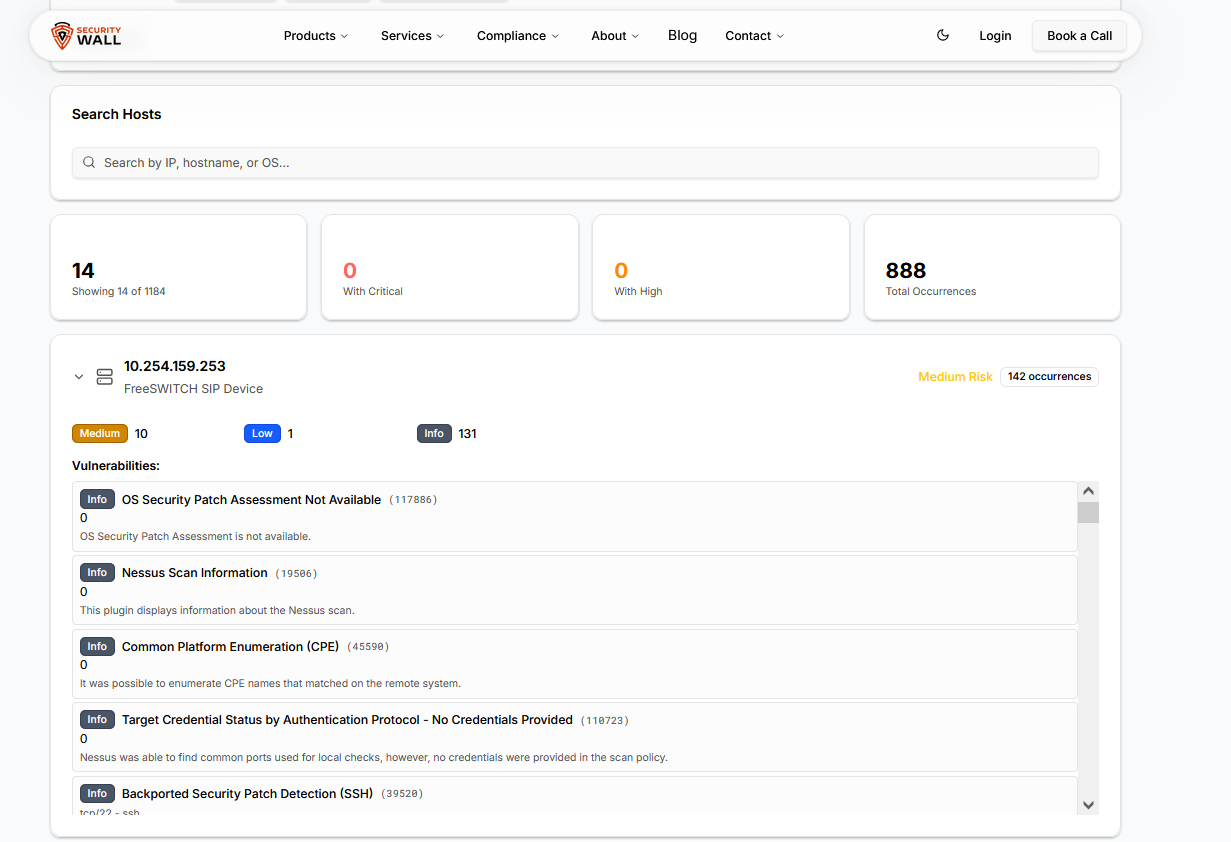
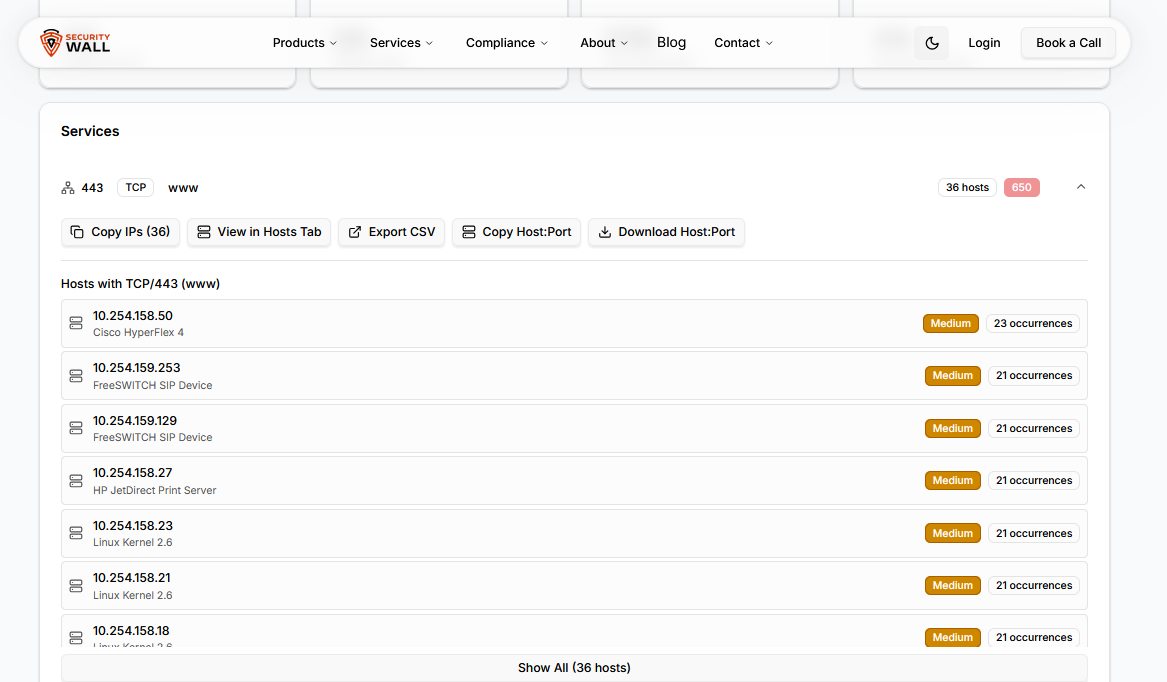
Visualizing Nessus Scan Results for Faster Decisions
To overcome these limitations, many teams choose to visualize Nessus reports instead of reading raw exports.
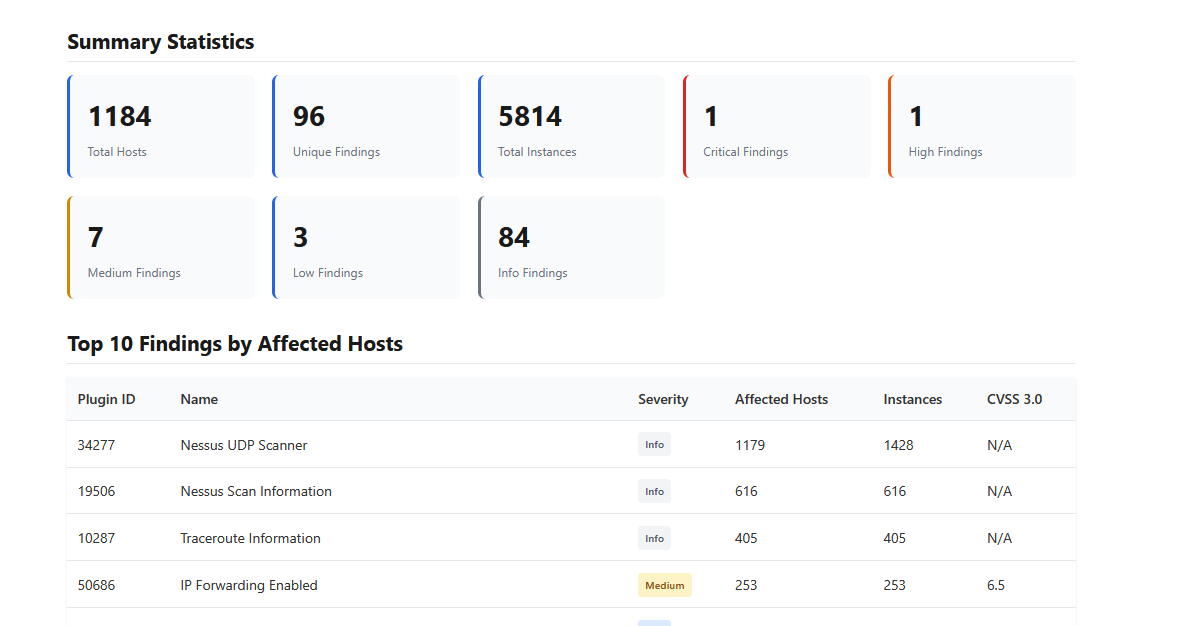
A Nessus report visualizer helps by:
- Grouping vulnerabilities by host, service, and severity
- Highlighting the most vulnerable assets first
- Reducing noise from informational plugins
- Making scan results understandable for both technical and non-technical stakeholders
You can analyze your scan results using the Nessus report visualizer, which converts Nessus XML and CSV files into clear, structured insights.
If you want to understand how this works in practice, this guide explains the process step by step:
Free Nessus Report Visualizer: Instantly Understand Your Nessus Scans
Turning Nessus Findings into Actionable Security Outcomes
Nessus is a detection engine, not a decision-making tool.
To turn findings into real security improvements, organizations often combine Nessus scans with:
- Structured vulnerability assessment findings to prioritize risk
- Validated penetration testing reports to confirm exploitability
- Continuous security platforms like SLASH to track risk over time
This layered approach ensures vulnerabilities are not just identified, but understood, prioritized, and resolved.
If you’re trying to figure out how to read a Nessus report, the challenge isn’t the scan it’s the interpretation.
Severity levels lack business context, plugin IDs create noise, and CSV/XML formats hide real risk. Visualizing Nessus scan results bridges the gap between detection and remediation, allowing teams to focus on what actually matters.
Understand your Nessus scan in minutes
Try the free Nessus report visualizer.